The History of Bourbon
infographics
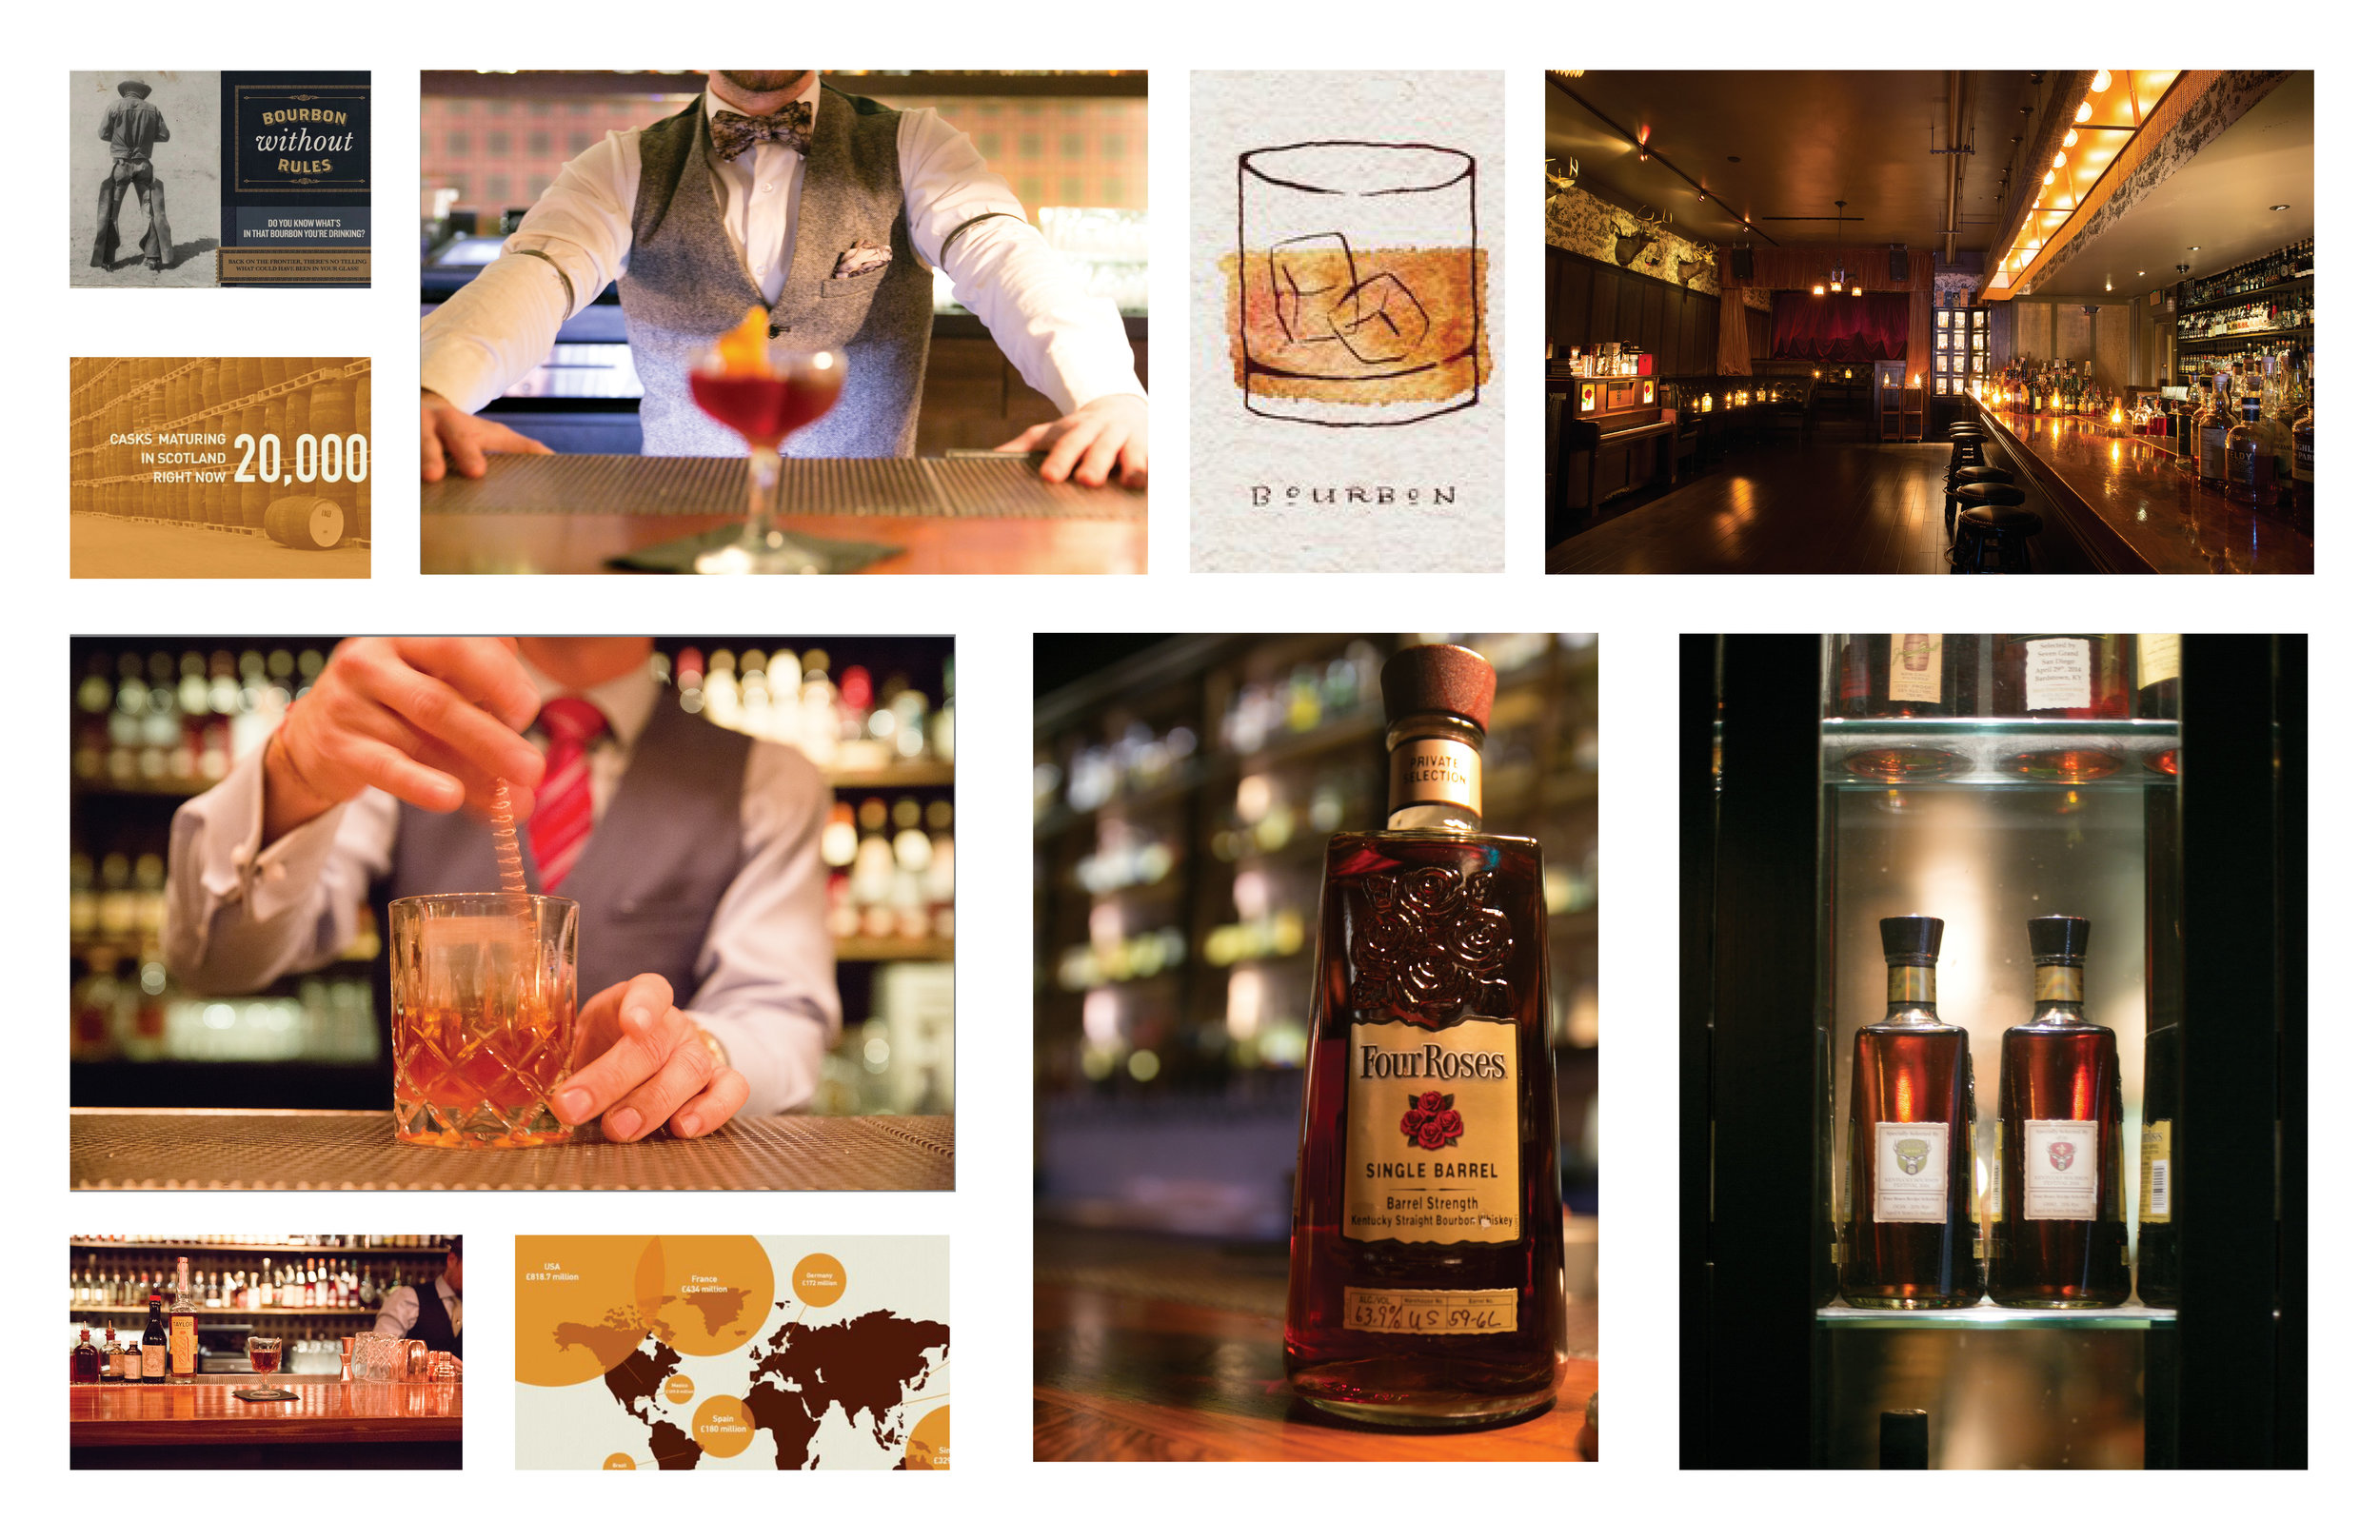
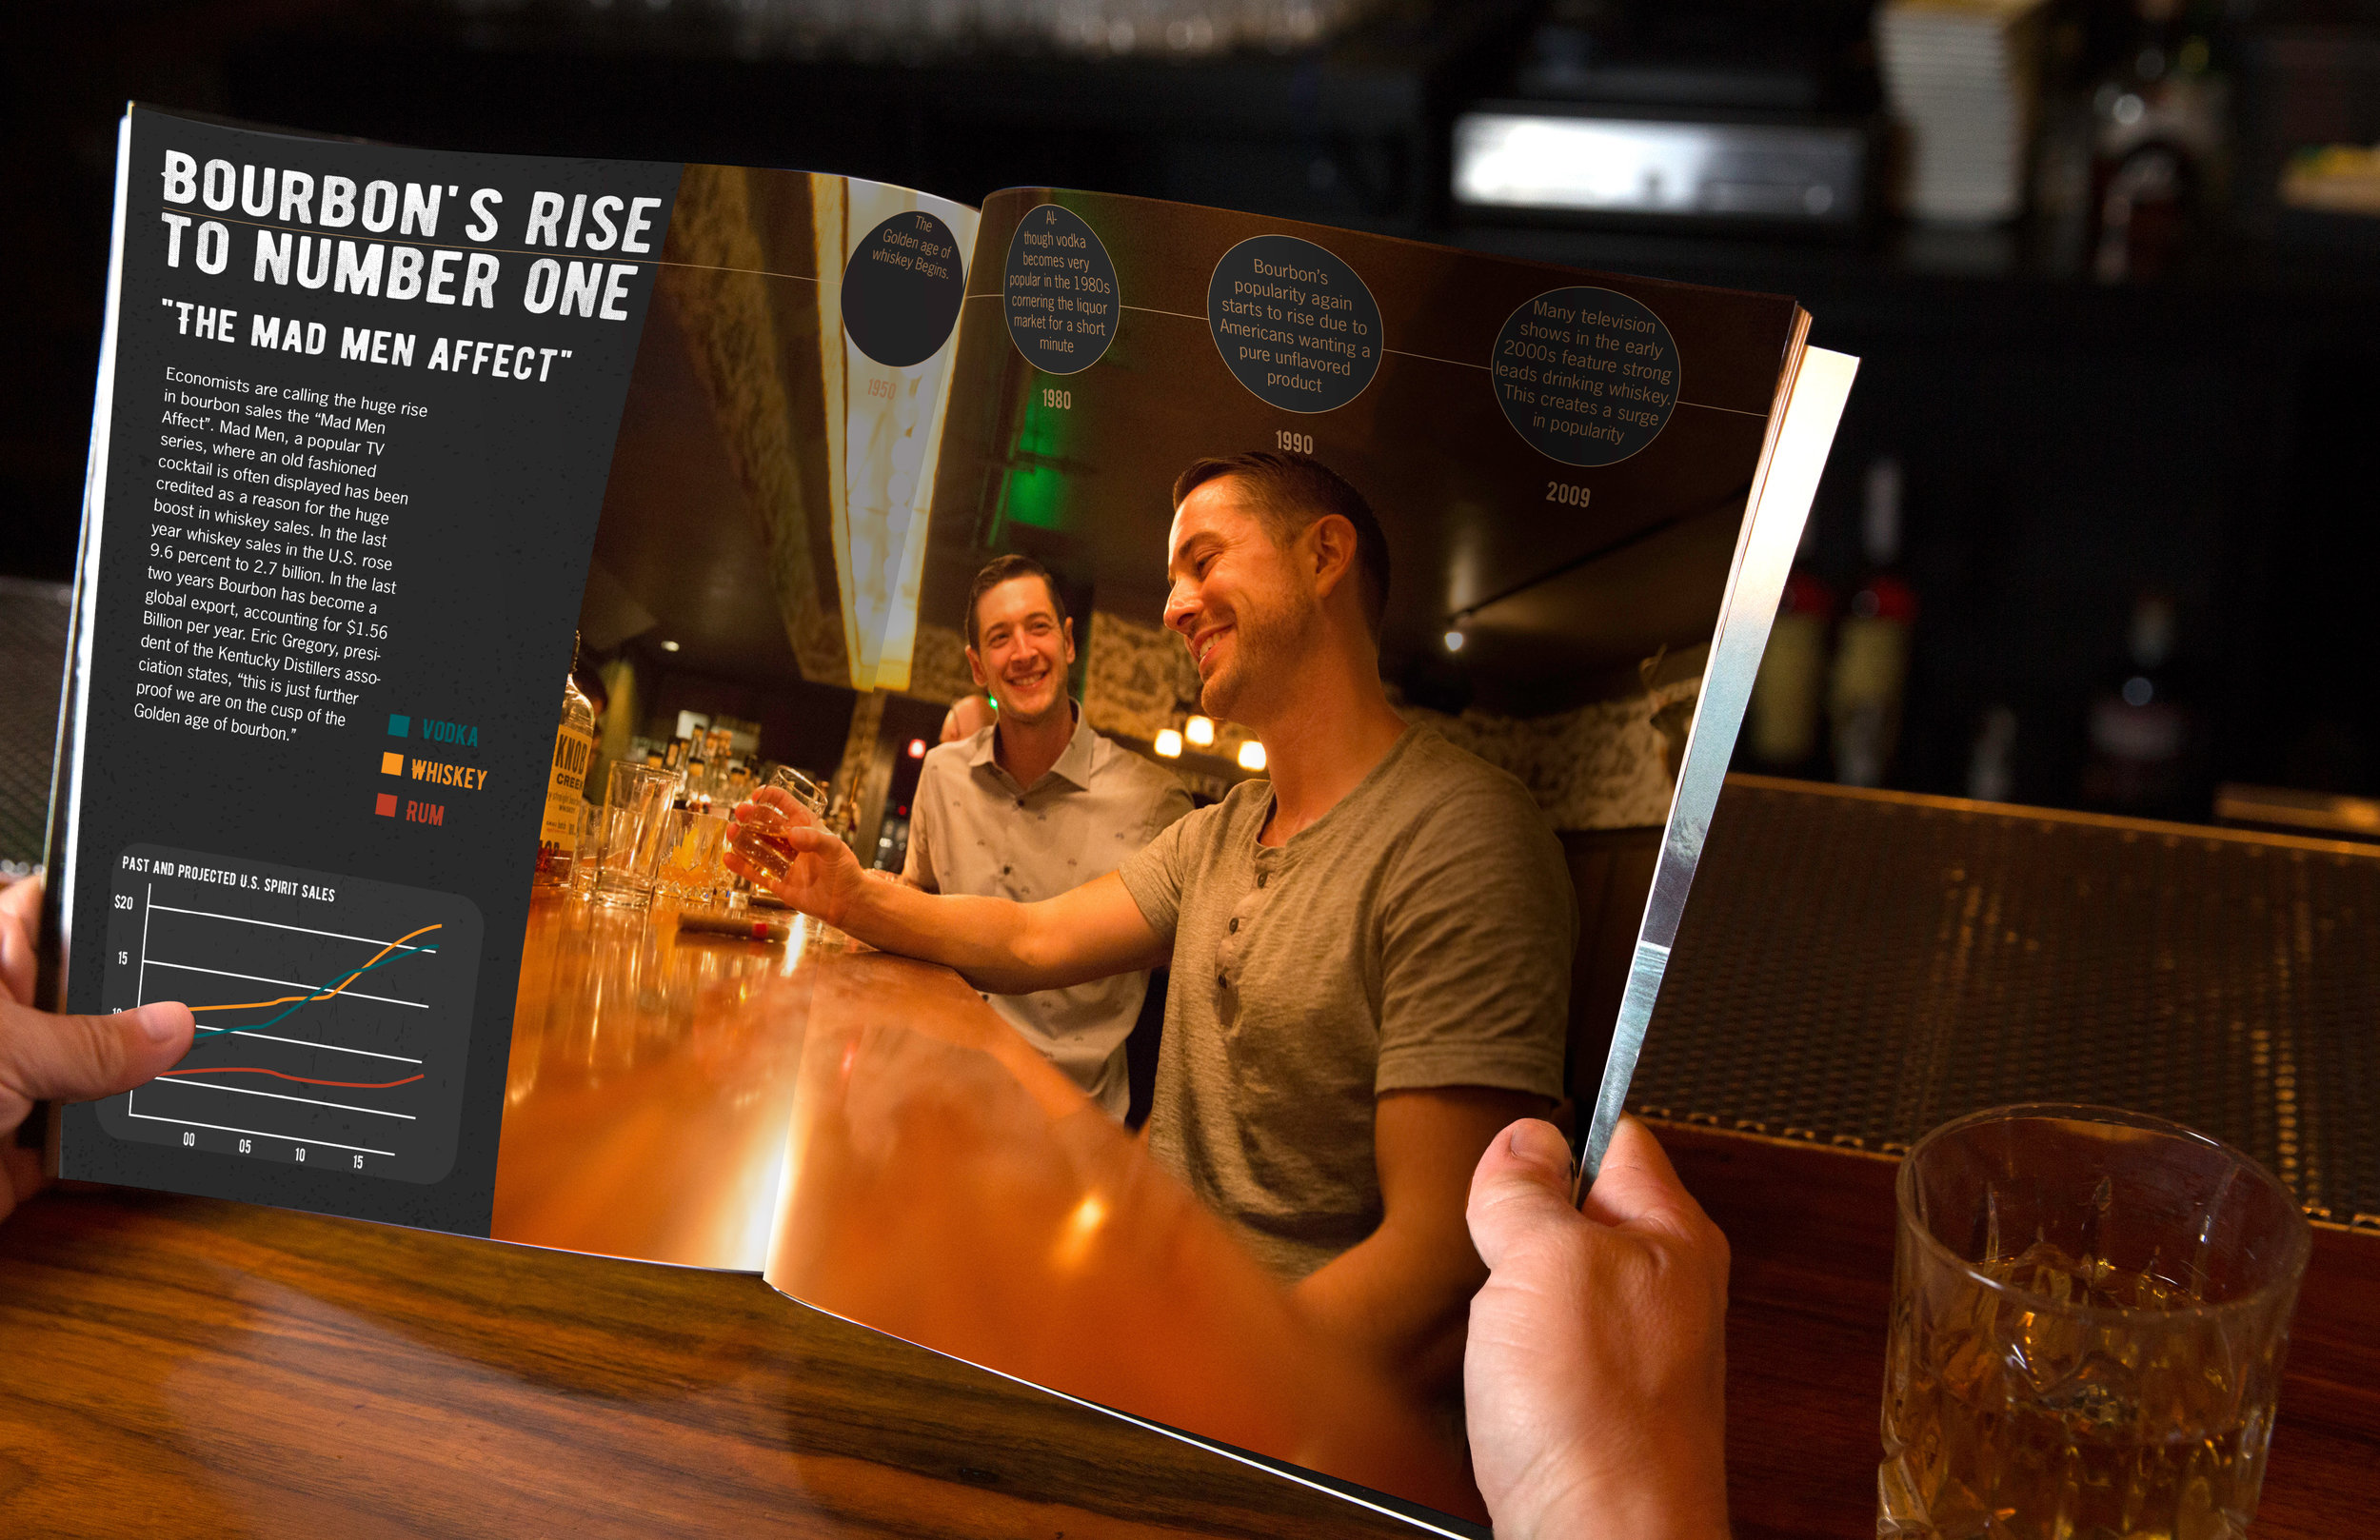
The goal of this project was to understand data and then create an infographic displaying the findings in a manner that is easy to understand and is visually pleasing to the viewer. I studied the factors in which bourbon has risen to the number one grossing liquor in America. Social factors, cultural changes, and pop culture were studied to see how sales are affected. In order to fully understand the patterns of liquor sales I studied Bourbon through historical books. I then compared the sales of different liquors within the last few years; lastly magazine articles about the current state of the bourbon market were analyzed. I then turned data findings into graphic models and visual graphs.
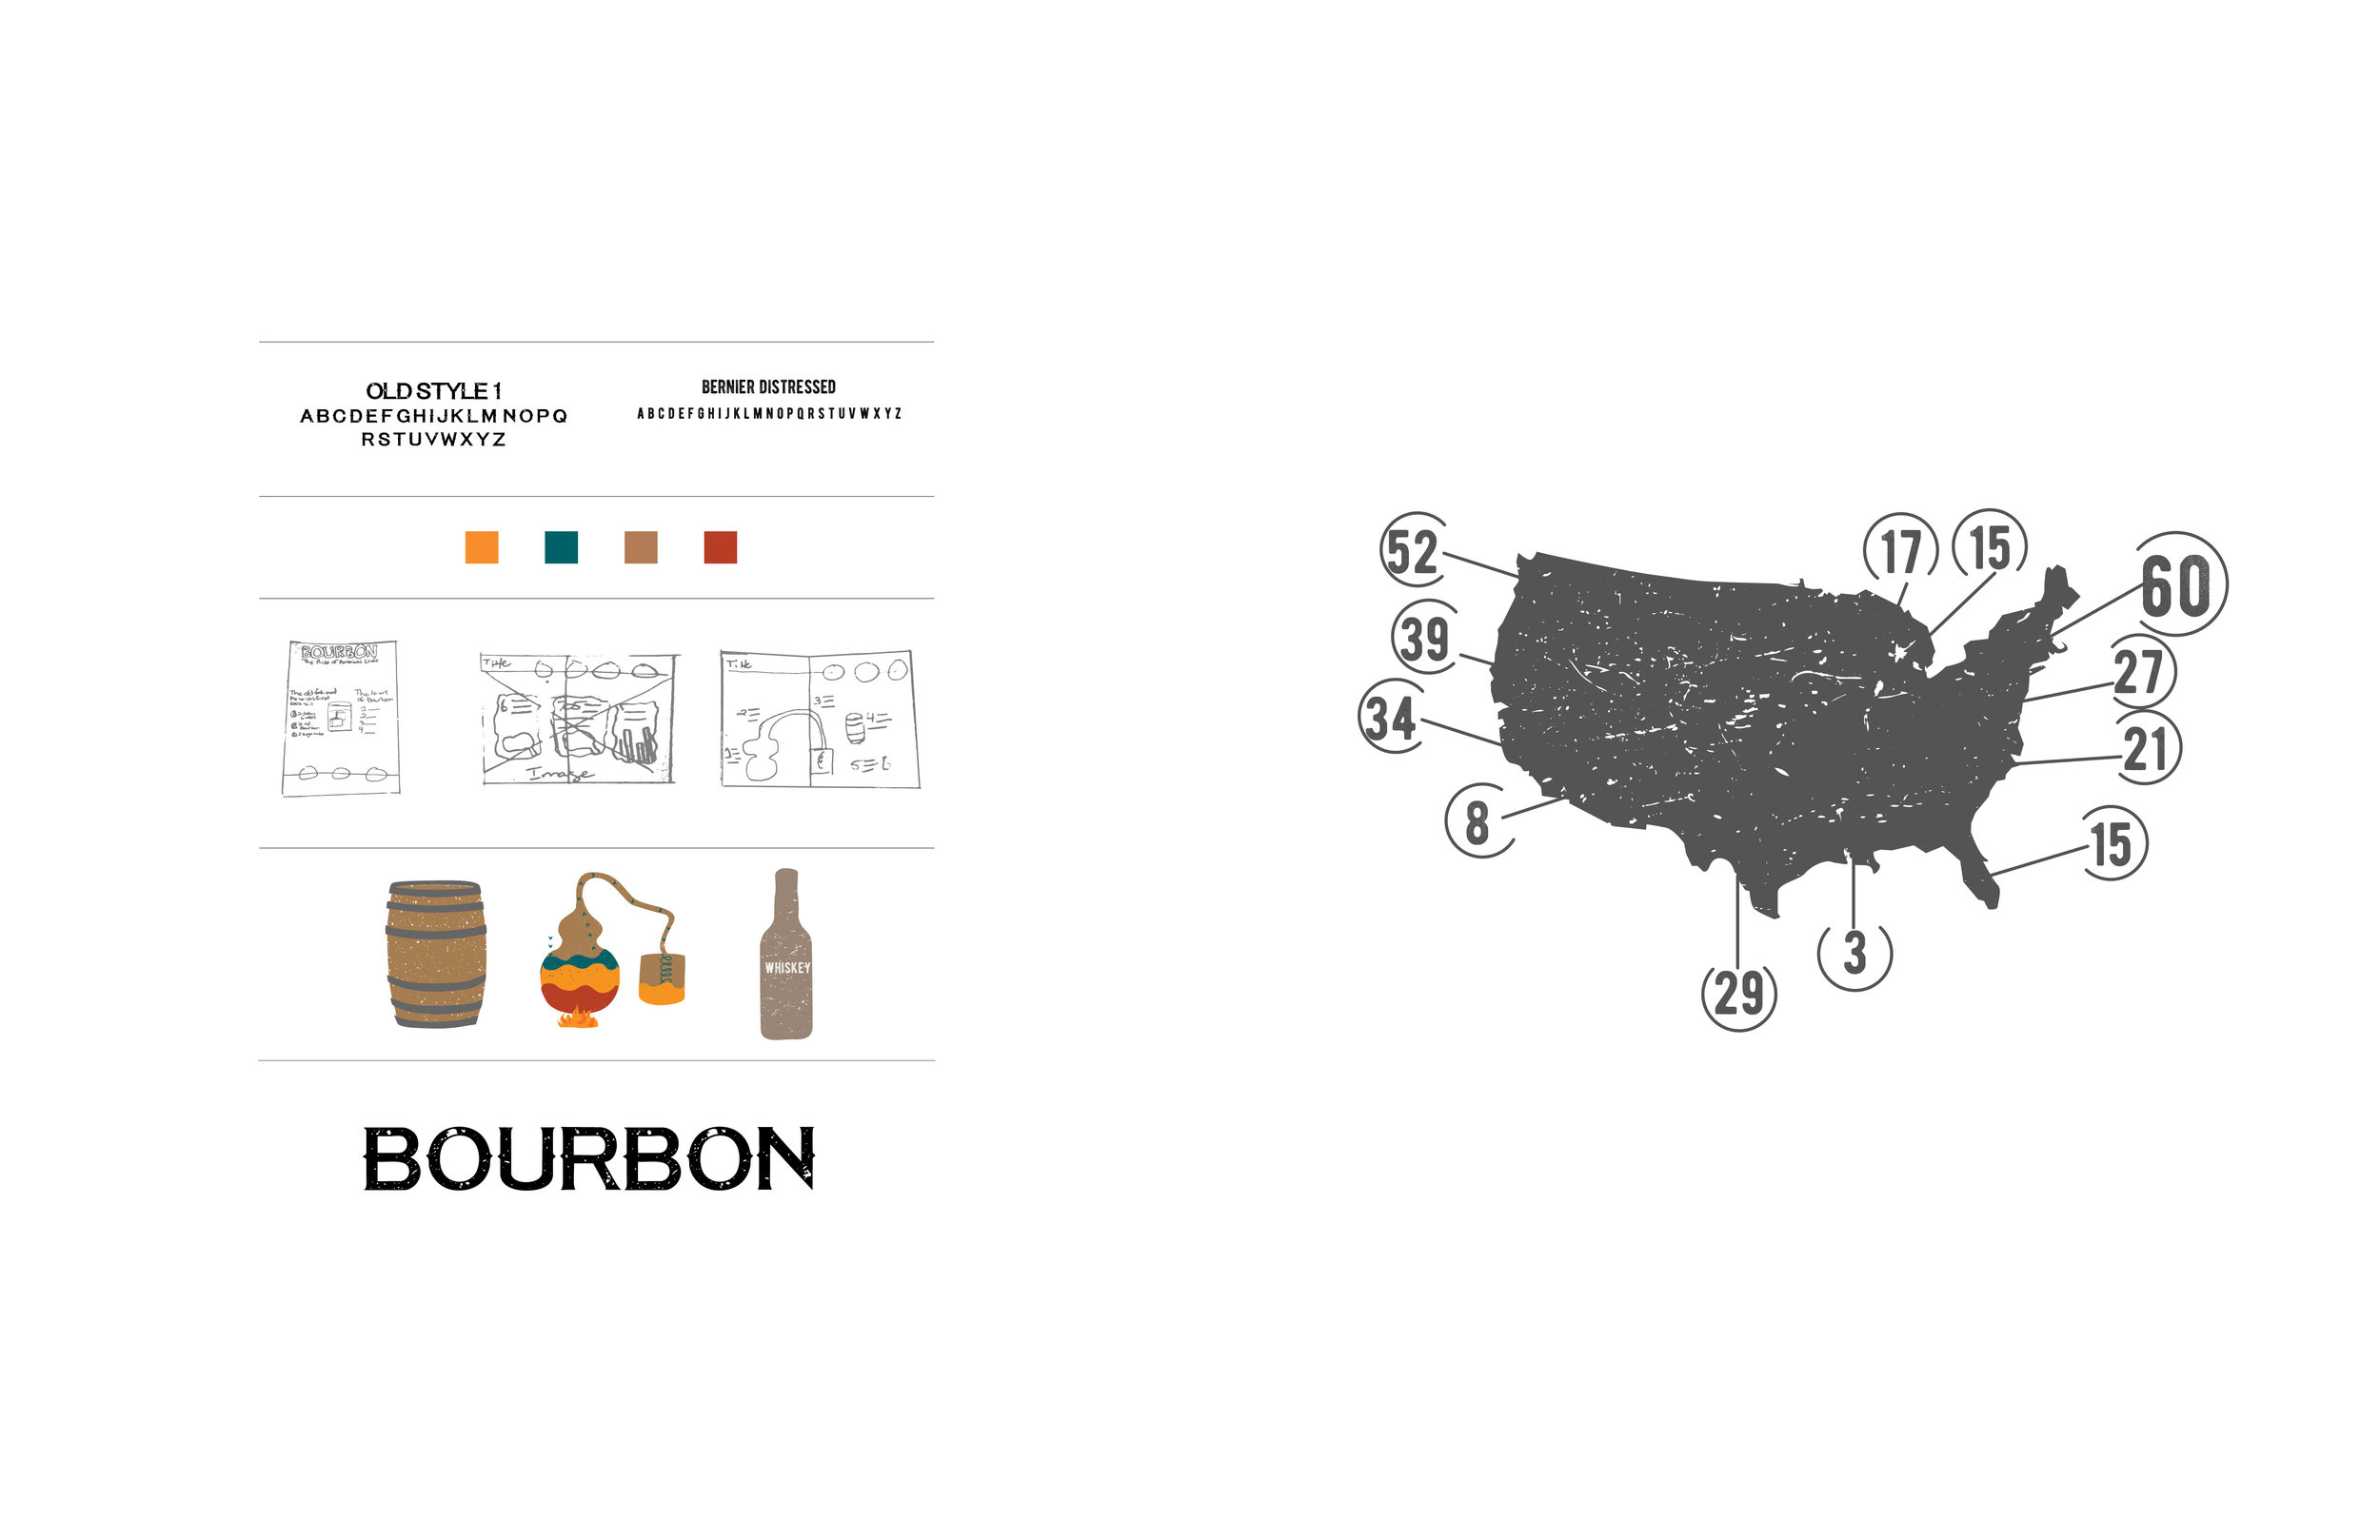
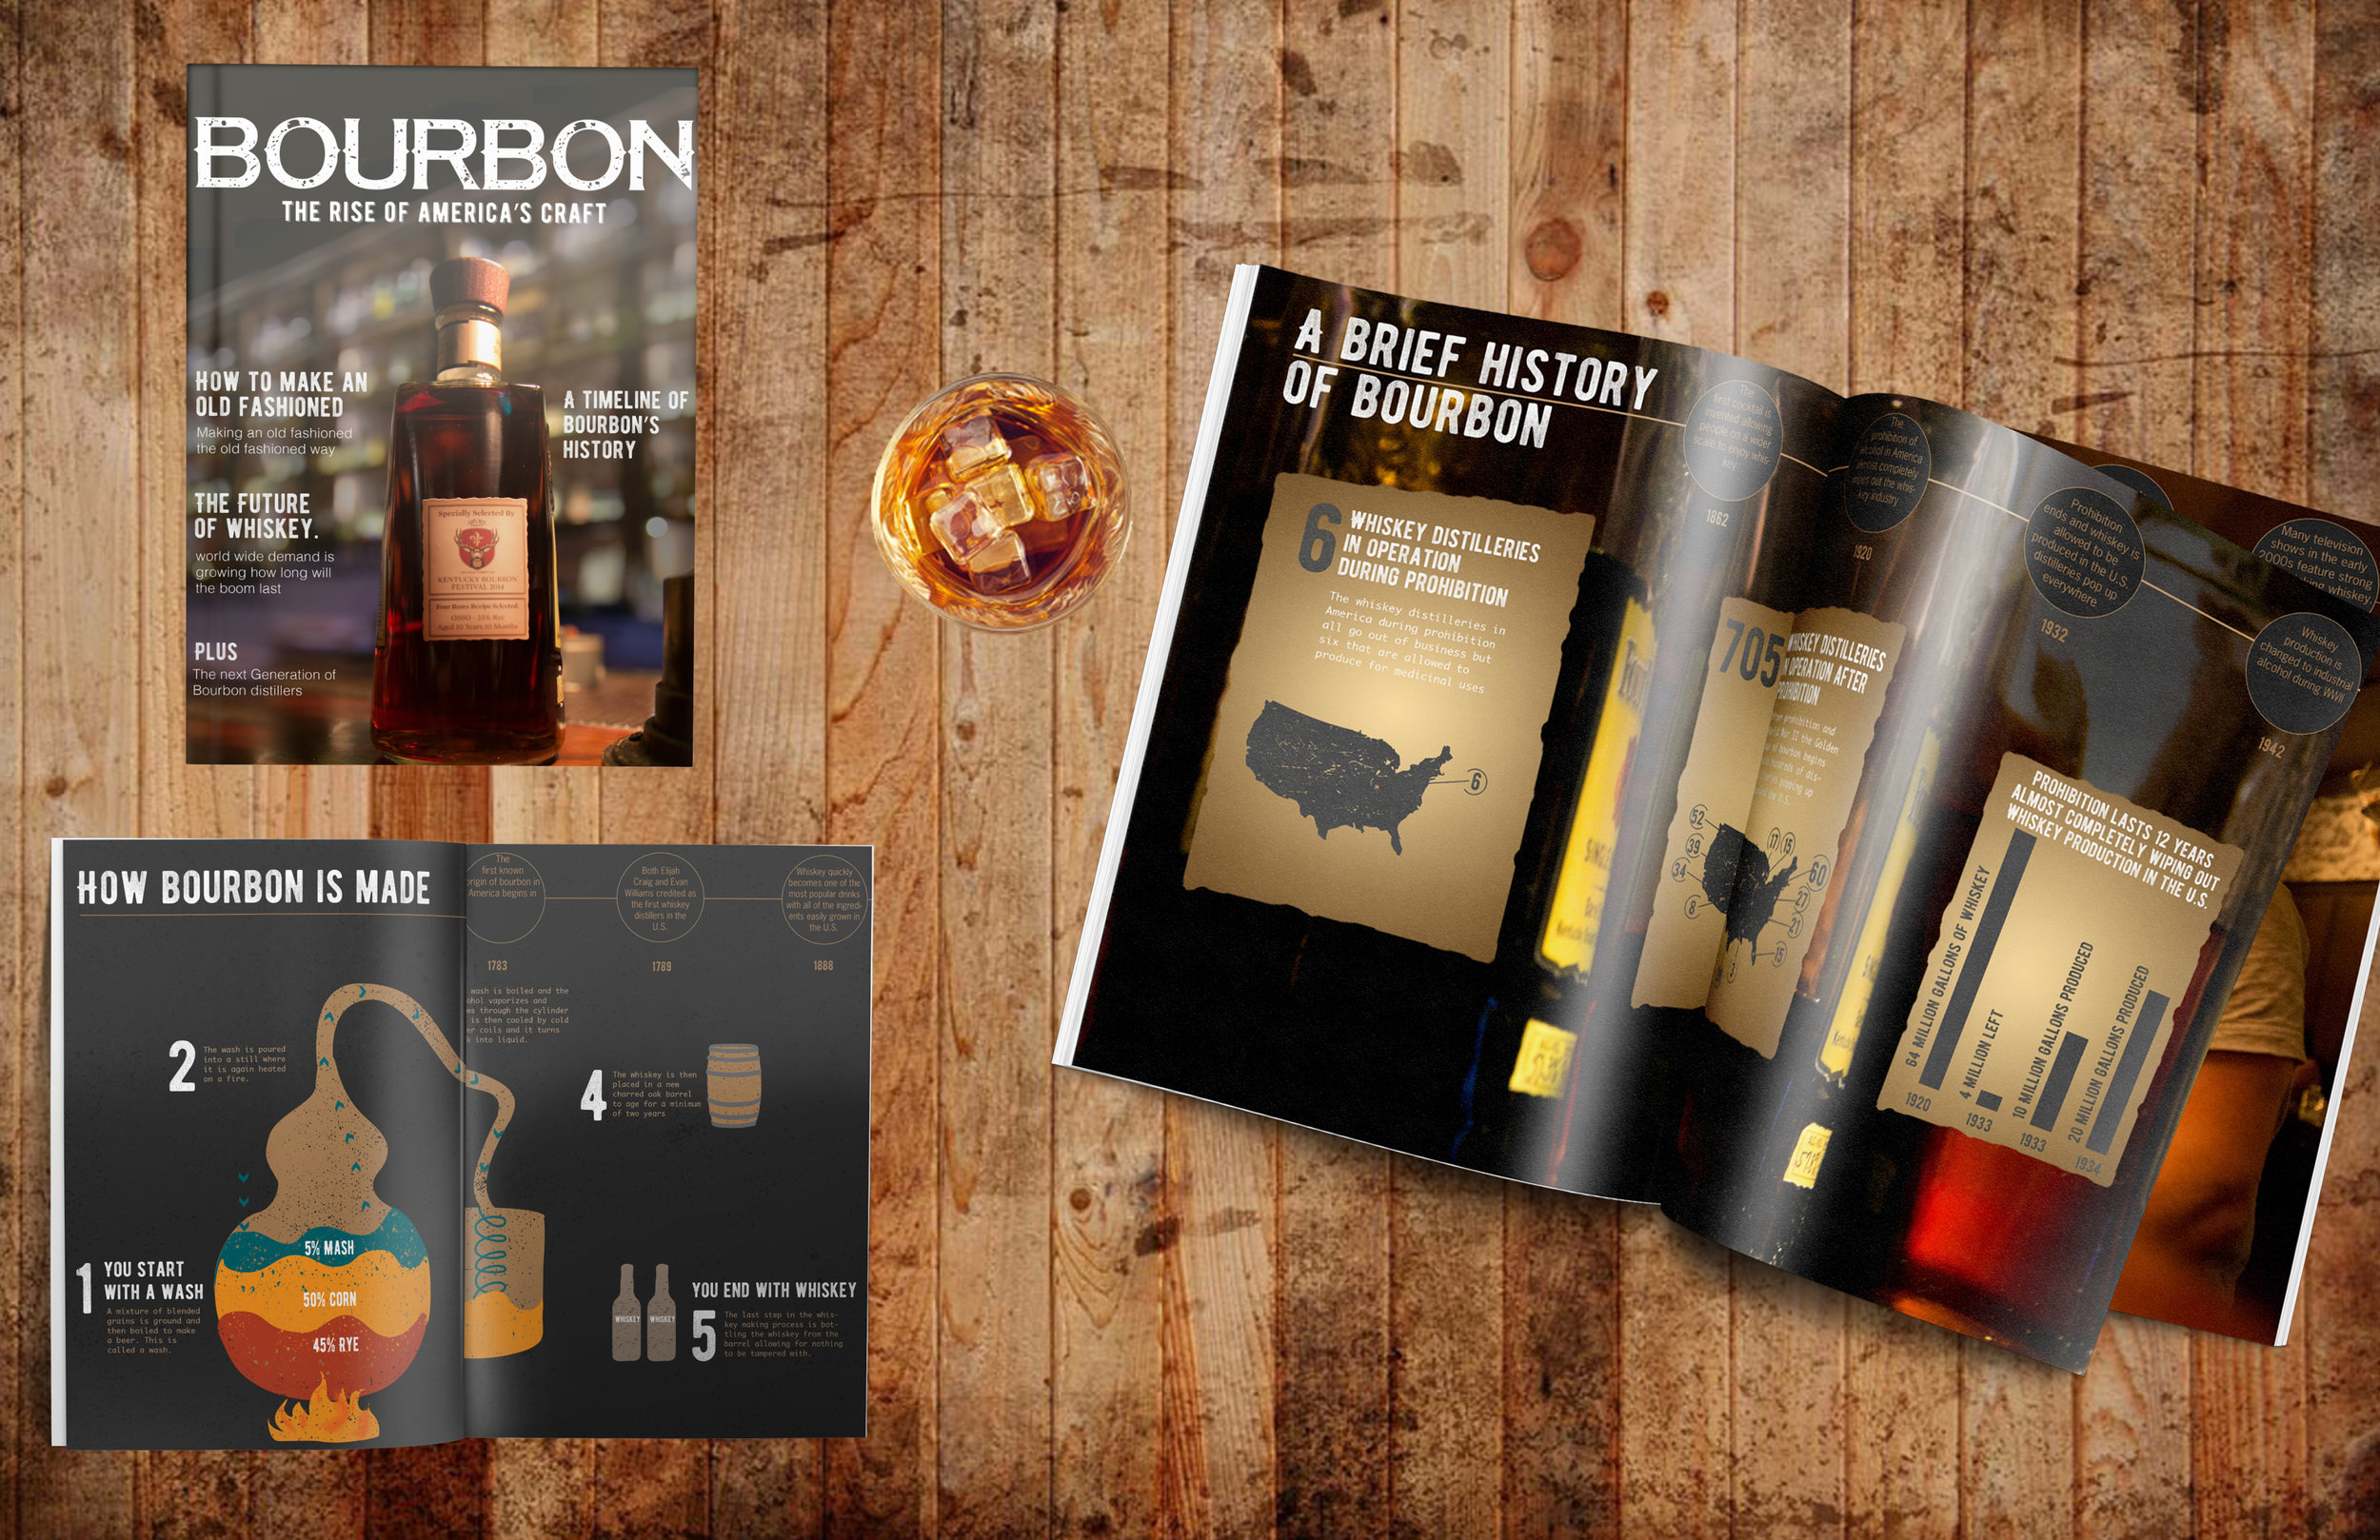
The result of this project was a Poster highlighting the information, a six page magazine article giving a more in depth understanding and visual model of the information, and a short video displaying the information in movement. The colors mostly used were shades of brown to highlight the caramel brown colors in whiskey. The font used was Bernier, a rustic font that had a distressed look that emphasized the longtime process of whiskey, which sits in barrels. I continued with the distressed look throughout the different spreads giving everything a texture, keeping the layout cohesive.